React Chart Demo
React app showcasing histograms, progress bars, sparklines, and tables.
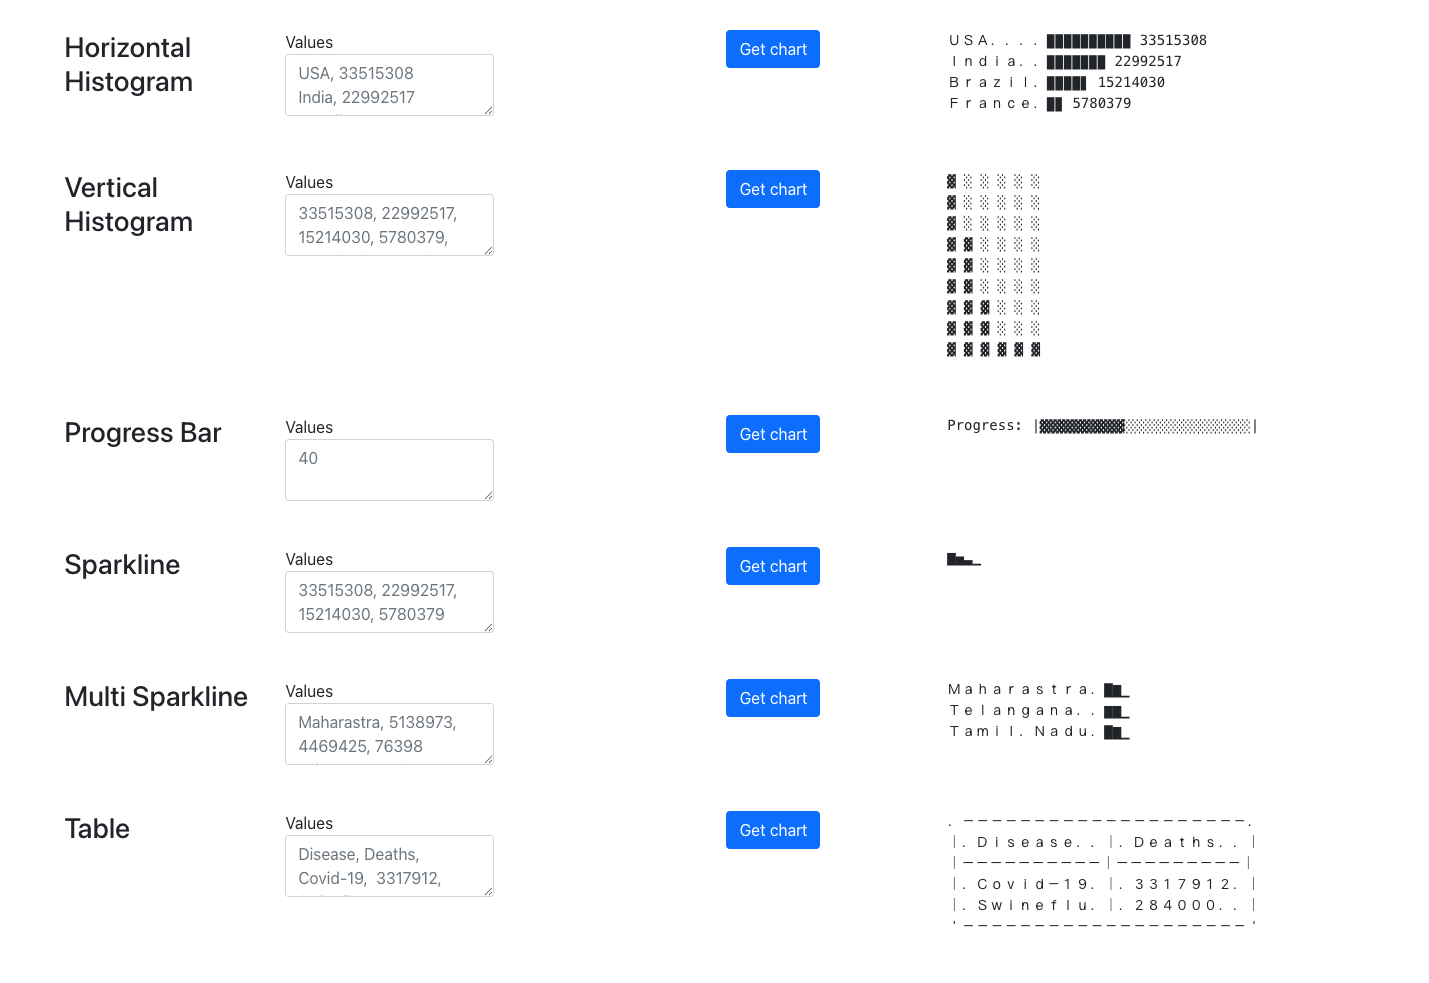
A lightweight web application built with create‑react‑app that demonstrates a collection of reusable UI components for data visualization. Users can generate horizontal and vertical histograms, progress bars, single and multi‑sparklines, and formatted tables with a single click. The demo highlights clean React implementations, responsive design, and easy customization, making it a handy reference for developers building dashboards or analytics interfaces.