Data Viz Palette Generator
Create balanced, visually‑equidistant color schemes for any chart or dashboard.
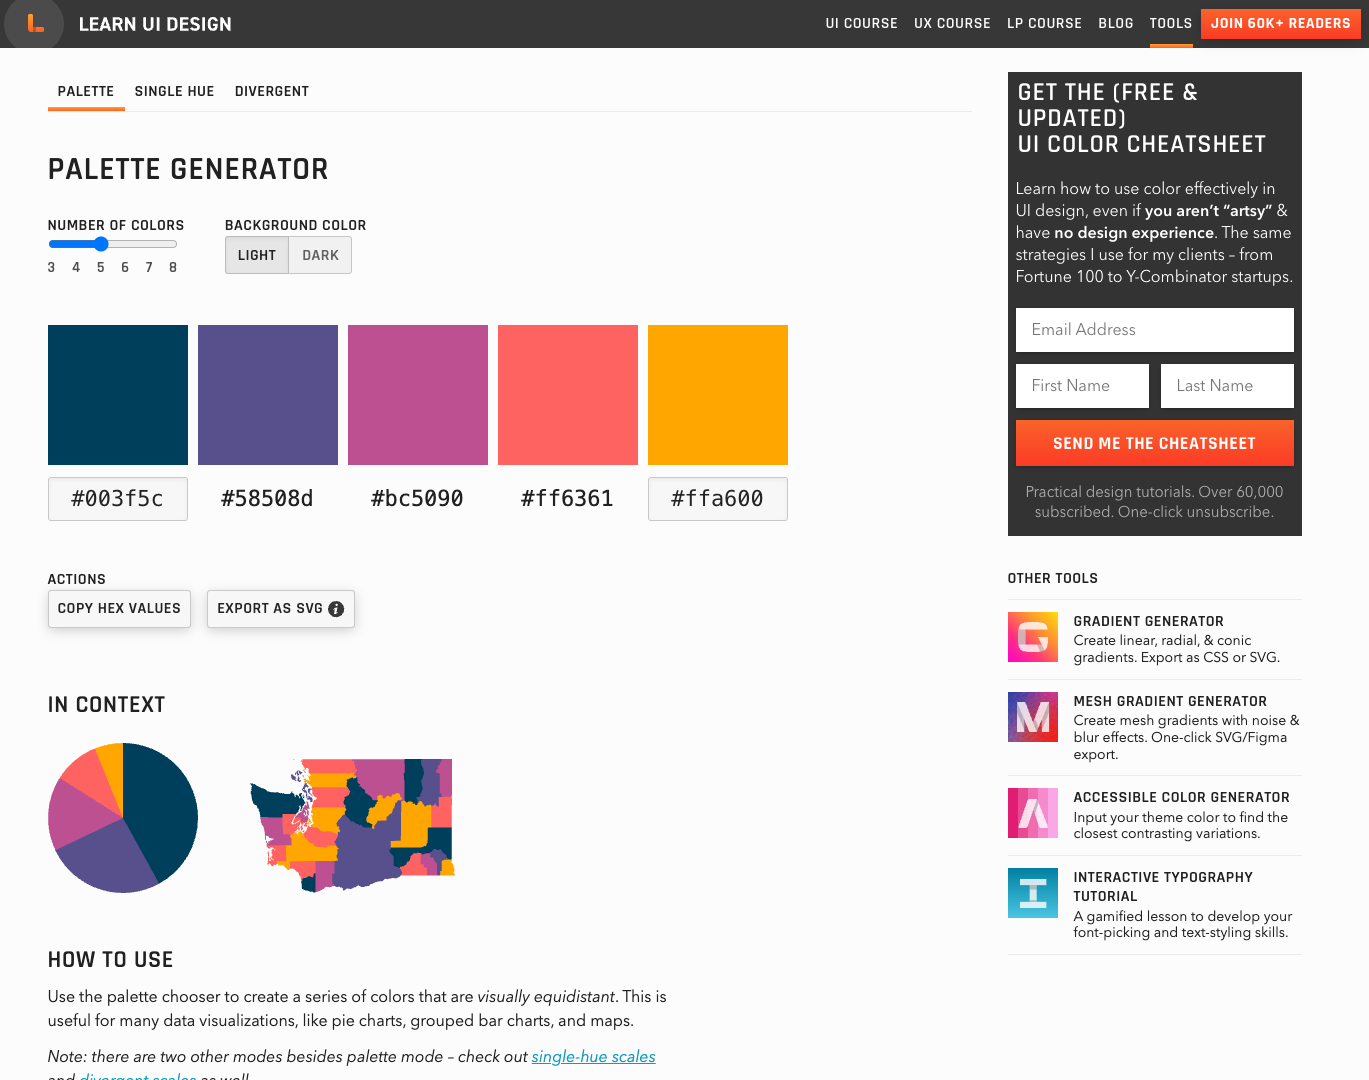
A web‑based tool that generates color palettes optimized for data visualizations. Choose from full palettes, single‑hue scales, or divergent scales, set the number of colors, adjust brightness and intensity, and toggle light or dark backgrounds. Export HEX values, copy them instantly, or download SVG files. Endpoints can be brand colors, ensuring consistency while delivering perceptually balanced hues for charts, maps, and dashboards.